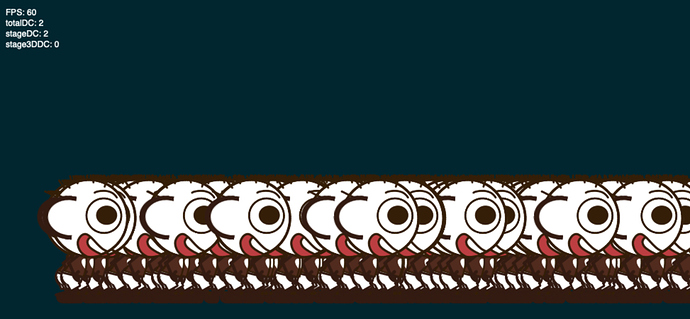
For some reasons my html5 build doesn’t have stable 60 fps. It drops from time to time to 30 and increases back to 60. No logic or animations happen during that time. Screen remain static.
Can you advice where to dig. Some cool profiler, coding and project (build) configuration tips?
You can start with the Chrome developer tool, it has a memory profiler, you could find a memory leak in your app (just look for the highest number in the memory column)
Canvas or WebGL? Are you using vectors (sprite.graphics.drawLine/drawRect)? Are you using tilemaps?
Any special library for animation/collision/physics?
Hi. Using webgl, assets from swf. No physics.
Also using this spine runtime:
But even if I do not use it - result is the same.
By the way, what is better to use Array<> or Vector<>?
I am pretty sure the problem is Spine, it looks like it periodically does some kind of memory refresh and the app hangs for an instant.
Vector is you are not constantly reallocating the size of the object, if you need the size dynamic array is better.
My bet is that both spine and swf are killing your performance. I think a lot of performance is being lost due to triangles (mesh deformations from spine) and bitmaps not being batched. (and if the swf graphics are vectorial and not being rendered to bitmaps that can also drag you down)
If i am correct you should see improvements in the batcher branch:
haxelib git openfl [email protected]:openfl/openfl.git batcher
note: the batcher branch is still in development and everything might explode in little pieces.
(you will then need to remove the “git” forlder from your haxetoolkit/lib folder to reverse to the release versions).
OpenFLSpine could improve performance by using a pool.
When using Spine, don’t use a lot of isNative=true; internal frame events use the ENTER_FRAME event, which can be optimized with a single event.
Yes, the issue is with Spine. But it need it 
Can you please show a little example how?
FPS drops to 20 or lower when I play several animations at one time 
Is 60FPS not playing Spine? Probably how many things are running, you can start to see the number of drawCalls. ENTER_FRAME event I will provide a new version later.
I found some problems that are now optimized: when using Tilemap rendering, I can run 400 Spines up to 60 FPS at the same time; Sprite Native renders about 30 spine objects rendered; Sprite Triangles renders about 60 Spine object renderings.
Performance is relative, reduce drawCall as much as possible, and reduce the use of isNative.
You can update openfl-spine 1.5.1 version try it.
And you need add the code:
SpineManager.init(this.stage);
Thanks, I’ll test soon. Btw, how I can display drawcalls?
The performance is still low 
Especially, when animation contains color transforms.
Btw, can you make a flag to set color transform of animation to false?
If I use isNative = false, many of animations are broken, but it increases performance!
About drawcalls, you can add it:
var fps:openfl.display.FPS = new openfl.display.FPS();
fps.textColor = 0xffffff;
this.addChild(fps);
It seems that you use more isNative? This will undoubtedly hurt performance.
A lot of animation is usually avoided on one screen. Or use tilemap to improve performance.
isNative = false works wrong, if there are more than 1 animation.
If I play 1 animation, It shows the first frame of other animations
If the color conversion is disabled, will performance improve?
Is this a BUG? If so, you need to provide the location of the error, as well as the reference map. 

