
Hi! I have a simple game (targeting to HTML), but it work very slow in old devices, what is the best way / tool to optimize the game? I used the chrome profiler but I can’t get much information.
Hello @clover_labs I just modified my current info debugger so it could work standalone here is the code
an Example how to initialize it:
//black text
new InfoDebug(0);
//white text
new InfoDebug();
If you want somthing simpler that doesn’t display memory, you can always go with openfl.display.FPS.
Hope this helps 
It’s possible the older devices use canvas, not WebGL. If so, then you’ll have to be careful how many draw calls you make. Also, mobile devices tend to have a harder time with CPU-intensive tasks, so be careful about things that use a lot of performance, like reading and writing individual pixels
You can try using trace (stage.window.renderer.type); to know whether you have GL or canvas on the device
@PXshadow I will try it! Thanks
@singmajesty I will check that, but I think that I having a memory issue
@player_03 I had already tried hxScout, but I can’t even open it on mac. I will try on windows!
Thank you all!
I’m not sure it’s in development anymore, and I’ve only ever used it on Windows. Maybe they never finished porting it to other platforms.
Install Chrome Canary, it has a few more interesting profiling options and experiments in the Performance tab
Excellent I will try! Thanks
I had trouble with hxScout on Mac as well, but moving it to the Applications folder seemed to make it work.
It’s really nice nowadays. You can record it, and then easily select parts of the timeline, zoom in, see the function call breakdown, etc. Many of the features were available before, however it’s now all in one spot. With the experimental timeline settings enabled, you can also see arrows where an event started, and on which frame it ended - and which function it called. Etc.
There is an extra live performance monitor tab - that is always running. But it might be harder to find. You need to open the Console, click on the Console’s 3 dots > More tools > Performance monitor
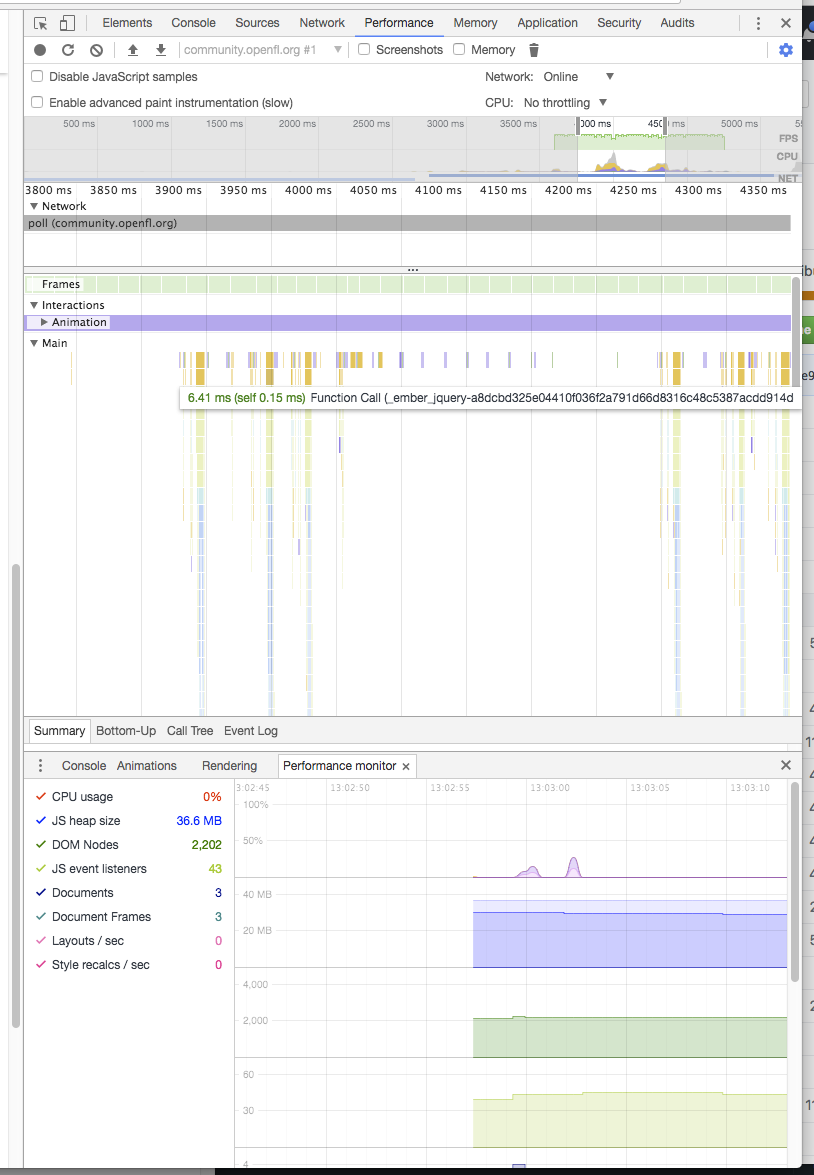
For experimental features open the Console, click on the Console’s 3 dots > Settings > Experiments
Then press SHIFT 7 times.
No joke 