
Good catch! I added a private __smooth property to each filter, which allows support for smoothing. I have it turned on by default
I guess I found another thing related to this memory leak. Having a sample code like this:
package ;

import openfl.display.BitmapData;
import openfl.display.Bitmap;
import openfl.display.Sprite;

import openfl.events.Event;

class Main extends Sprite {
    public function new() {
        super();

        var bitmapData:BitmapData = new BitmapData(1024, 1024);
        bitmapData.perlinNoise(1024.0 * 0.1, 1024.0 * 0.05, 5, 123, true, true, 7, false);

        this.addChild(new Bitmap(bitmapData));
        this.addEventListener(Event.ENTER_FRAME, function(_) {
            this.invalidate();
        });
    }
}
and here is a performance profile from Chrome’s Dev Tools:
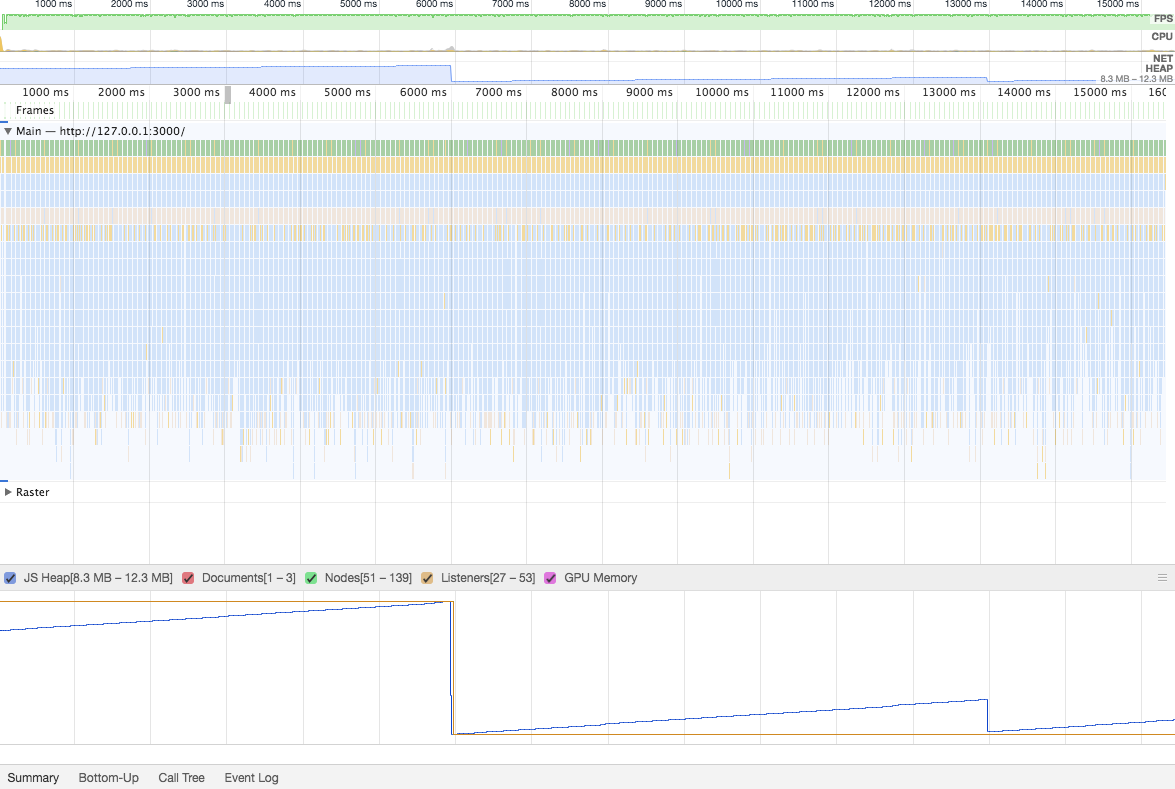
It is super-hard to track back this memory increase but I guess it is not something standard or maybe I should worry not about this - whenever I disable that invalidate() enter frame event it gets back to stable memory usage value. In my specific application it uses a lot more (screens in the initial post). For Starling it rendered even though I’ve disabled similar event while in my OpenFL implementation based on DisplacementMapFilter it completely stops so I guess Starling looked like an issue because it never stopped.
I will try to investigate this a little more and any help would be appreciated. It may be running smoothly even with these issues but I guess it would be great to pinpoint this and fix it somehow or at least to know which component exactly makes memory go crazy like that.
I’ve tried disabling things in OpenGLRenderer::__render() but nothing worked unless I disabled all of these but I guess it is the main entry for rendering so that does not help very much 
parent.onUpdate.dispatch (Std.int (deltaTime));
if (window.context != null) window.onRender.dispatch (window.context);
Browser.window.requestAnimationFrame (cast handleApplicationEvent);
Hmm, I gave this a try, but on my machine, it occasionally spikes up to about 10 KB of memory, but it doesn’t appear to be doing very much… maybe a little mess caused by mouse events?
Not really, idling causes the same memory sawtooth.
Did gave it a try too.
Chrome does show a saw-tooth memory usage.
Firefox on the other hand showed zero difference in memory snapshots.
Lets blame Chrome and move on 
That may be true because I was rather struggling reproducing this on Firefox (also could not access System.totalMemory on Firefox co I could not read memory easily while playing).
I guess the blame is on Chrome then but it’s over 50% of the market share so that’s really an issue 
I’ve checked one Unity WebGL app and on Chrome it also had these sawtooth for memory usage. I also checked one other WebGL framework, Playcanvas and it never went over 5MB of memory, was pretty much constant all the time (maybe I’ve checked something in a wrong way). I do not know what are the differences though but I guess knowing what causes these would be surely nice 
Here you go guys: https://stackoverflow.com/questions/17382321/requestanimationframe-garbage-collection - it’s a bug since 2013. I wrongly checked performance of Playcanvas - it also has this problem.
I guess the only way is to super-optimize app and keep fingers crossed they will do something about it after roughly 6 years 
1 Like