Getting started with OpenFL and Haxe in VSCode: My first-time experience

Hey OpenFL community,

This afternoon, I decided that I wanted to give OpenFL a try. Kick the tires a bit. I have 15 years of experience in ActionScript and Flash, and I am also well versed in frontend web development using TypeScript/JavaScript.

A long time ago, I gave Haxe and OpenFL a try, but I decided (at the time) that it wasn’t for me. It’s been a few years (or maybe more), and I figured that it might be interesting to see where things stand a few years later. Since I never took a deep dive, I’m basically a complete newbie. As a library/product author myself, I know that it’s very valuable to see the getting started experience from a new user’s perspective. Long after you’ve forgotten the struggles yourself, it can be hard to remember (or guess) what’s hard for someone that’s never used your project.

I am a heavy user of Visual Studio Code. I use it both for TypeScript/React and ActionScript/AIR/Royale/etc. In fact, I’m the guy who created the AS3 & MXML extension for VSCode.

Part 1: Installation and Create Project

To start my journey, I searched for “openfl vscode” on Google. This led me to the Github page for the Lime and OpenFL extension for VSCode. I search for this extension inside VSCode and install it.

At this point, this is the first that I’ve heard of Lime, but since the extension is for both OpenFL and Lime, I guess Lime must be somehow related to OpenFL. I go to the Lime website and click the “Get Started” button. It looks like I need to install Haxe and the Lime command line tool to get started with the VSCode extension. I follow the instructions to do this, and then I create one of the samples and open it in VSCode:

lime create SimpleImage
code SimpleImage

Hmm… it seems that this sample code contains zero references to OpenFL. I guess this means that Lime and OpenFL are not supposed to be used together after all? Something to research later, I guess.

Okay, so I head to the OpenFL website, and I see that OpenFL has its own command line tool too. I install it and create another sample:

openfl create DisplayingABitmap
code DisplayingABitmap

This sample code seems more like what I was expecting!

However, I immediately get an error notification in VSCode:

Unable to build cache - completion features may be slower than expected. Try fixing the error(s) and restarting the language server.
[Retry] [Show Error]

Clicking “Retry” just re-displayed the same error.

Clicking “Show Error” gave me this output:

Haxe language server started
Listening on port 6000
Haxe version does not support JSON-RPC, using legacy --display API.
Building Cache...
Failed - try fixing the error(s) and restarting the language server:

Type not found : ApplicationMain

What does this mean? No idea, so I head to Google. I find this thread that says I need to compile one time before everything will work properly in VSCode:

I press Ctrl+Shift+B and it gives me a task: lime build html5, so I run it.

Then, I click “Retry” again on the original error notification.

The error doesn’t get shown again, so that seems to have fixed things! The completion list pops up as I type, tooltips appear on hover, and Ctrl+Click to go to definition works. Looks like I’m on the right track so far.

I’ll share some more experiences below, as I try out other things.

My Feedback/Suggestions

However, I think that it’s really important for the VSCode extension to explain that a project needs to be compiled one time to work properly. Not everyone is going to be patient like me. I’m used to being an early adopter. Many developers will just assume that the VSCode extension is broken.

5 Likes

Part 2: Launch and debug

I should point out that I couldn’t find any obvious links to tutorials on the OpenFL website where it lists VSCode as a supported editor/IDE, nor was there anything in the README file for the VSCode Lime extension. In particular, there’s no mention of debugging, which is what I wanted to try next.

Luckily, I know how to debug web browser projects in VSCode already. I’ve used VSCode’s debugging extensions for browsers like Chrome and Firefox with both TypeScript and Royale. However, not everyone will have that pre-existing knowledge, so some kind of documentation would be really helpful.

Let’s see here. I already know how to build my project with Ctrl+Shift+B. Additionally, I noticed in the status bar that there’s an item that says “Release”. It seems intuitive that I should be able click it and change from “Release” to “Debug”. Yes, I see a pop-up with “Release”, “Debug”, and “Final”. I don’t know what “Final” is, and how it might differ from “Release”, but I’ll look into that later.

I see that building creates an HTML file in Export/html5/bin. I create a launch configuration for Chrome:

{
	"type": "chrome",
	"request": "launch",
	"name": "Launch Chrome",
	"file": "${workspaceFolder}/Export/html5/bin/index.html",
}

Then, I start my debug configuration.

I see the following output in VSCode’s Debug Console:

The AudioContext was not allowed to start. It must be resumed (or created) after a user gesture on the page. https://goo.gl/7K7WLu
DisplayingABitmap.js:20040
Access to image at 'file:///C:/Users/josht/Development/OpenFL/DisplayingABitmap/Export/html5/bin/assets/openfl.png?6984' from origin 'null' has been blocked by CORS policy: Cross origin requests are only supported for protocol schemes: http, data, chrome, chrome-extension, https. [file:///C:/Users/josht/Development/OpenFL/DisplayingABitmap/Export/html5/bin/index.html]
Failed to load resource: net::ERR_FAILED [file:///C:/Users/josht/Development/OpenFL/DisplayingABitmap/Export/html5/bin/assets/openfl.png?6984]
js__$Boot_HaxeError
DisplayingABitmap.js:27369

I guess this means that I need a server. No big deal. A lot of web frameworks require that. I quickly launch one with Node.js:

npx http-server Export/html5/bin

Then, I create a new launch configuration:

{
	"type": "chrome",
	"request": "launch",
	"name": "Launch Chrome",
	"url": "http://localhost:8080",
	"webRoot": "${workspaceFolder}/Export/html5/bin"
}

To test, I added a trace() call in my code. I also create a MouseEvent.CLICK event listener on a Sprite and add a breakpoint inside the listener in my .hx file. When I launch in Chrome, I see my console output in VScode, and when I click the Sprite, VSCode’s debugger stops at the correct line and shows the local variables that I would expect. It’s great to see that source maps seem to “just work” without any configuration on my end.

My Feedback/Suggestions

As I mentioned above, there don’t seem to be any docs for debugging in the couple of places where I assumed that I would find some. I think that this will make it pretty hard for someone less experienced with VSCode to get started. It actually took me several minutes to realize what I needed to do too, to be honest. I had to switch contexts and ask myself, “how would I do this in TypeScript or Royale?”

By the way, I happened to find this thread that talks about using the Run Test Task command to run your project:

As a VSCode extension developer myself, I’m not sure that this command is being mapped to the correct action. As I understand it, Run Test Task is supposed to be for running unit tests or other types of automated testing.

4 Likes

Hey, I’m one of the maintainers of the Haxe / VSCode ecosystem. :slight_smile:

  • The first issue regarding a build being required before code completion works has been a known issue for a while and is specific to Lime / OpenFL projects (not a general issue with Haxe support in VSCode). This has actually finally been fixed recently and will no longer be an issue starting with the next OpenFL / Lime releases.

    Btw, as an extension dev yourself you might find it interesting that under the hood, the Lime extension uses an API exposed by the Haxe extension to provide code completion.

  • OpenFL is built on top of Lime and its build tools. In fact, the openfl command is basically just a
    really thin convenience wrapper around the lime command.

  • Similar to how the Lime VSCode extension doesn’t do all that much regarding code completion and the Haxe extension does the heavy lifting there, the various debug adapters that are available are also separate extensions and documented separately in their readmes. The Haxe extenion’s wiki has an overview over the options for the various targets:

    https://github.com/vshaxe/vshaxe/wiki/Debugging

    There’s also some documentation I once wrote for HaxeFlixel, which is a game engine built on top of OpenFL. However, none of it is really Flixel specific technically speaking, not even the .vscode config generated by flixel-tools (which includes a launch.json):

    https://haxeflixel.com/documentation/visual-studio-code/

  • lime test html5 / the test task actually launches a webserver for you. The HTML5 target is the only one that’s a bit awkward in this regard due to the remote nature of it, other targets like Flash and HXCPP are a bit more convenient to debug IMO.

  • I’m not sure the “test” task kind has any pre-defined meaning - the API docs just say “test task group”. While it may be used for automated testing in other environments, it maps very well to the lime test / openfl test. For people already familiar with OpenFL, this is more natural I think.

    Besides, it’s usually quite rare for a Lime / OpenFL project to have unit tests, so that task kind would likely end up mostly being unused otherwise. :slight_smile:

5 Likes

This has actually finally been fixed recently and will no longer be an issue starting with the next OpenFL / Lime releases.

That’s great to hear! Thank you. That should improve the getting started experience a lot.

OpenFL is built on top of Lime and its build tools

Understood. That makes sense considering that the Lime sample code that I saw looked lower level than OpenFL.

However, none of it is really Flixel specific technically speaking, not even the .vscode config generated by flixel-tools (which includes a launch.json):
lime test html5 / the test task actually launches a webserver for you.

Thanks! I can see how these should be combined, and it’s good to see all the other targets in launch.json for when I need them. It might be good to include this info somewhere in the OpenFL docs or the README for the Lime extension. I didn’t even think to look at the docs for the Haxe extension, since I figured OpenFL specific stuff wouldn’t be there.

Thank you for the help and clarifications! It’s exactly the kind of details I was looking for.

1 Like

Agreed, the readme of the Lime extension definitely needs a link (or two) to the vshaxe wiki. :slight_smile:

1 Like

Just my two cents here:
I keep a openfl run html5 shell running and this is what my runner for debuggin on chrome looks like

        {
            "type": "chrome",
            "request": "launch",
            "preLaunchTask": "Build HTML5 Debug",
            "name": "HTML5",
            "url": "http://localhost:3000",
            "webRoot": "${workspaceFolder}",
        }

with my “Build HTML5 Debug” task being

        {
			"label": "Build HTML5 Debug",
			"command": "haxelib",
			"args": ["run", "lime", "build", "html5", "-debug"],
			"group": {
				"kind": "test",
				"isDefault": true
			},
			"problemMatcher": "$haxe"
        }

(But you could probably tie the task to the lime extension runner probably.

Yes, I think you should be able to use the auto-generated task instead with this:

"preLaunchTask": "lime: build html5 -debug"

This has the following advantages:

  • it would automatically use the full list of problem matchers ("$haxe" is just one of several, so some errors wouldn’t work correctly for you)
  • it respects the "haxe.taskPresentation" setting
  • it respects the "haxe.enableCompilationServer" setting
  • it respects the "haxe.executable" and "lime.executable" settings

The downside is that you have to have “HTML5” and “Debug” selected in the status bar for the task to exist.

Is it possible to make all build tasks always available, regardless of which items are selected in the status bar? Personally, I’d rather not need to click around in the UI to get it into the right state first, when the quicker option could be to select a different item in the task list. I understand if there’s some technical limitation that makes this impossible, of course. It just seems like extra steps to me.

It’s actually not really a technical limitation, but consider this:

  • there’s 5 tasks for the different commands right now (build, test, update, clean, run)
  • there’s currently 8 (!) targets to choose from, with HashLink yet to be added sometime in the future
  • there’s 3 build configurations, debug, release and final

If you multiply all that out, there would be a total of 120 tasks. That just seems like way too much. :slight_smile:

I’ve been discussing this with Joshua a bit, I think what we would want here is the possibility for task providers to contribute hidden tasks, so that all tasks always exist to be used in debug configs, but don’t pollute the UI as much (only the active ones wouldn’t be hidden).

Oh, and also: the picker has more purposes than just selecting the target to use for tasks. It also changes the code completion arguments. This is necessary for completion to work properly for platform-specific APIs and conditional compilation blocks like #if js.

And you don’t have to click around in the UI, everything is bound to commands you can assign shortcuts to. I have this in my keybindings.json:

{
    "key": "ctrl+e",
    "command": "haxe.selectDisplayConfiguration",
    "when": "haxeCompletionProvider == 'Haxe'"
},
{
    "key": "ctrl+e",
    "command": "lime.selectTarget",
    "when": "haxeCompletionProvider == 'Lime'"
}

Yeah, that would be way too many tasks to show. My initial thought was that you could hide tasks for all but the current target, but then I guess it would be somewhat inconsistent. You don’t want the UI state controlling the visibility of some tasks, but not others.

Yes, this sounds good. I wasn’t aware that a task could be defined by an extension, and hidden from the UI. I’ll have to look into that.

In addition to making it possible to reference any task with preLaunchTask in launch.json, I think that it would also allow someone to force a task to always be visible by referencing it in their workspace’s tasks.json. That would give people control over which tasks are shown, which seems like it covers my request well enough.

Well, that’s the problem actually, the second part is currently not possible. We’re probably going to open a feature request on the VSCode repo for it and see how that goes.

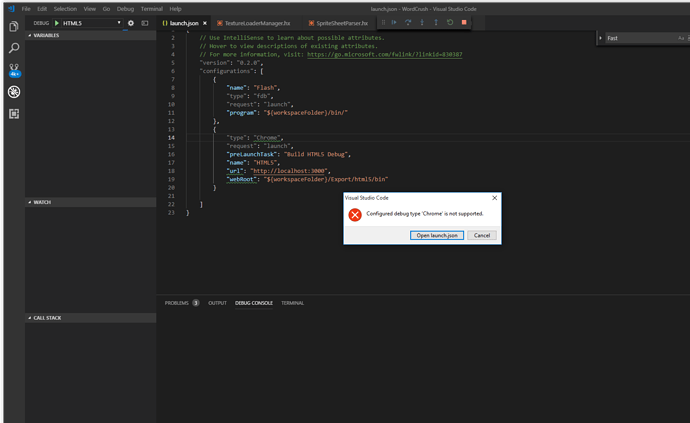
Can anyone help with this. I’m trying to run my project from VC but no way.
Is there any minimal project how to run and debug with VS code?

The "type" should be "chrome", not "Chrome". Also, you need to have the Chrome debugger installed.

OK, now it open chrome on localhost port 3000 but I get empty web page even if I point

"webRoot": "${workspaceFolder}/bin/html5/bin/index.html"

Also for the flash:

You need to run the lime test html5 task beforehand for there to actually be a webserver running for the debugger to connect to.

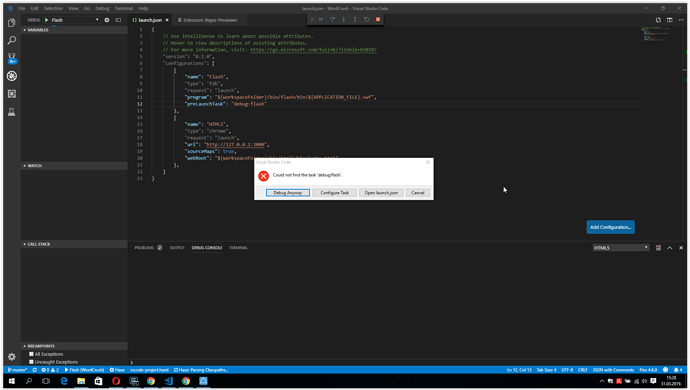
Your Flash launch config seems to have some debug:flash preLaunchTask that doesn’t exist.

Everything works now but for the flash I must explicitly write file name:
"${workspaceFolder}/bin/flash/bin/WordCrush.swf" -this works
but this won’t:
"${workspaceFolder}/bin/flash/bin/${APPLICATION_FILE}.swf"

Yes, you’re not meant to use the latter as-is. Did you copy that from flixel-templates? APPLICATION_FILE is replaced with the correct value when running flixel-tools.

Yes, I copy it from flixel-templates. I was think {$APPLICATION_FILE} is internal haxe variable. Is there a way to put file name into variable in openfl VC project?

I don’t think so.

Anyway, this should all be solved with the next release of the Lime extension, where you will only need a single “lime” launch config that automatically populates the parameters for the selected target’s debugger. :slight_smile:

2 Likes