Is there are any ways to debug AIR Android/iOS apps with breakpoints?
Command
lime test air -android -debug
pack and install .apk on device, then app is waiting for debugger connection for the minute and then I’m getting (on mobile) message smth. like unable to connect to debugger. App starts after press Cancel in this message.
Do I need to execute another one command during this minute?
Or start app for debugging other way?
I’m using Win10 x64, IntelliJ IDEA + Intellij-Haxe plugin.
Maybe others IDE able to do it? Maybe some additional plugin settings needed?
P.S. Debug AIR for desktop work well with this plugin.
You can probably do it in Visual Studio Code with the Debugger for SWF extension.
You would add the following configuration in .vscode/launch.json:
{
	"type": "swf",
	"request": "attach",
	"name": "Attach SWF"
}
Depending on how Lime packages the AIR app, you might need this extra connect field in your configuration (and if that’s the case, you will need the device connected to your computer with USB):
{
	"type": "swf",
	"request": "attach",
	"name": "Attach SWF",
	"connect": true
}
Basically, try with connect and without to see which one works.
I think that you need to launch your app on the device first. Then, start the debugger in VSCode.
Suggested configurations have no effects - just “waiting” animation after launching. Looks like it can not connect to session.
Tried built-in “Install & Attach Adobe AIR (Android)” configuration - getting uninformative error:
Preparing to install Adobe AIR application...
Installing Adobe AIR application...
Forwarding port 7936 over USB...
Launching Adobe AIR application on device...
Launching app on device failed for platform "android" and application ID "test.dev.id" with status code: 14.
But suggested approach bring me to some idea - see post below. 
Finally I managed to debug Lime/OpenFl AIR app on Android device from within IntelliJ IDEA.
The main idea is to build and launch debug apk and then connect to it with regular Flash/AIR debug tool - fdb.
Steps in details:
- Modify lime tools.
Since we want to debug over USB, we have to update lime tools to build air android apk with -listen arg instead of -connect (I haven’t found any option to do this w/o modifying tools):
- checkout lime sources and switch to it (
haxelib dev lime dev)
- replace -connect with -listen argument (lime.tools.AIRHelper). Or see corresponding
pull request.
- rebuild tools (
lime rebuild tools)
- Create fdb connection configuration.
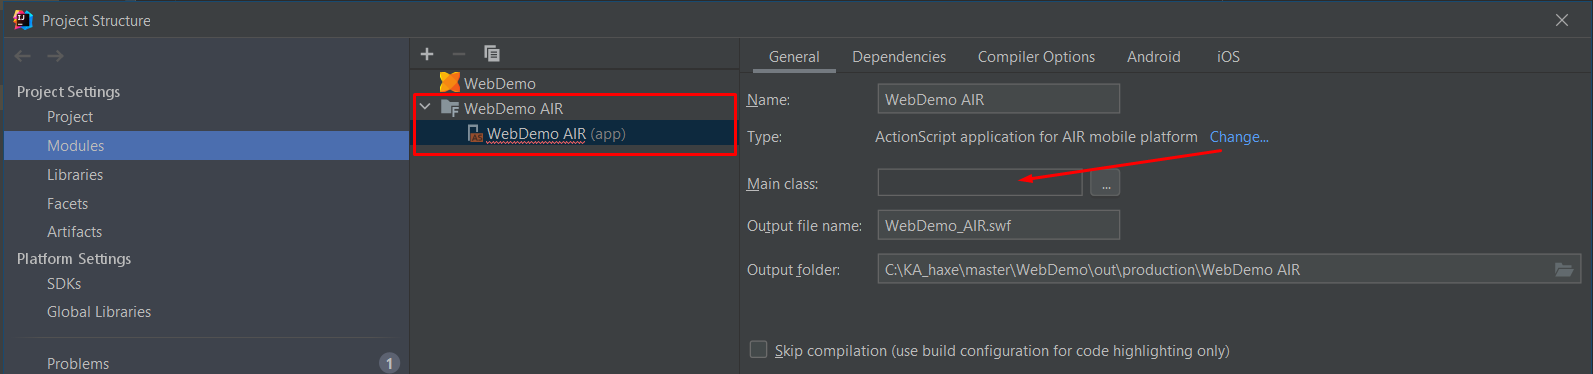
- create empty AIR module - it will be used just to avoid errors in next point
Example
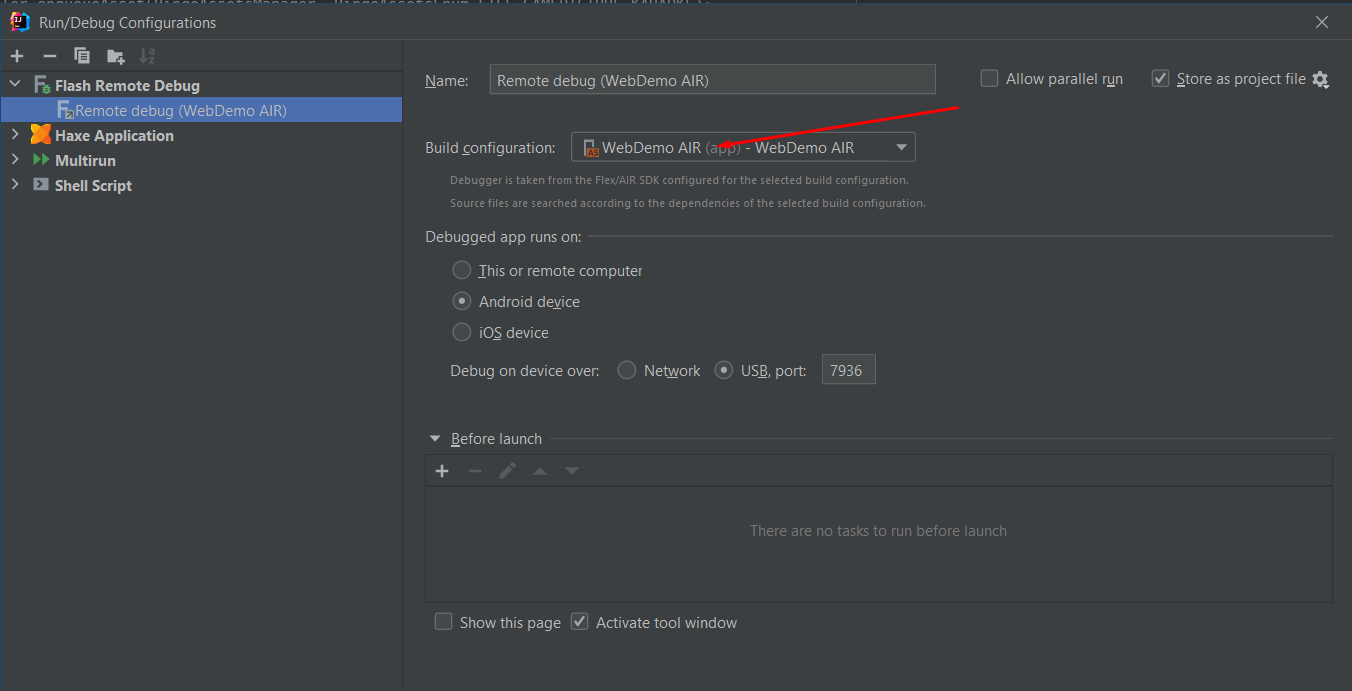
- create Flash Remote Debug configuration (provided by Flash/Flex plugin) and target previously created empty module
Example
- Build, install and run your app. E.g.
openfl test air -android -debug -v
- Within 1 minute after your app launches on device, start configuration from point 2 in debug mode. Player successfully connected, session started and everything works as you work w/ regulat AIR app or w/ Haxe AIR app in emulator (with help of Haxe Toolkit Support plugin): breakpoint, step over, step into etc.
That’s all. 
P.S. I created a sequence to build, install, run app and connect with debugger in one key:
Steps/pics
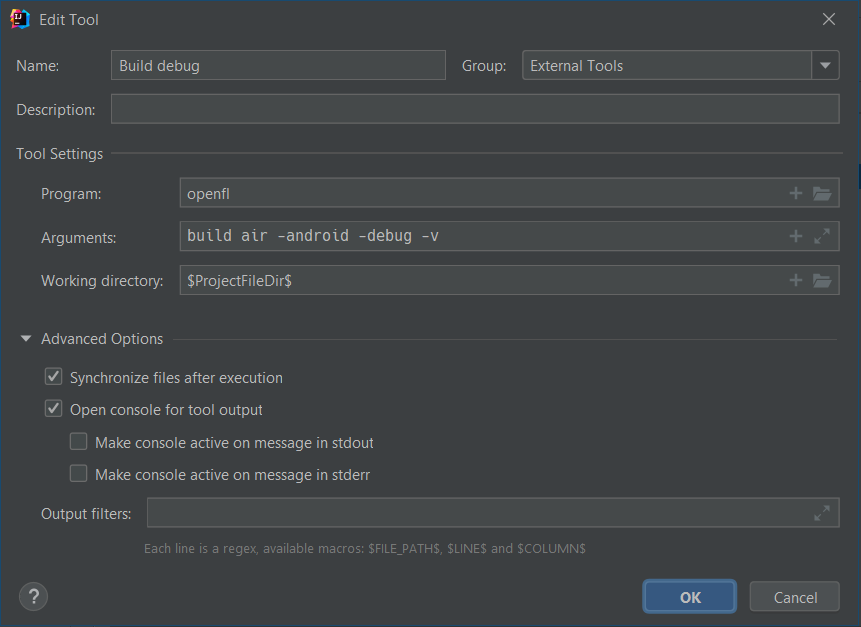
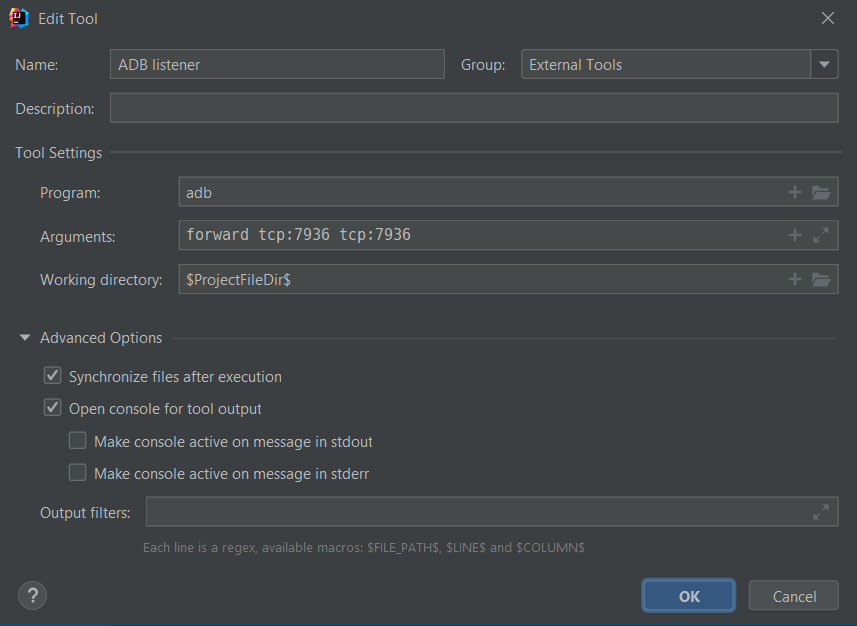
- Create build and port forward commands w/ built in IDEA’s External tools feature.
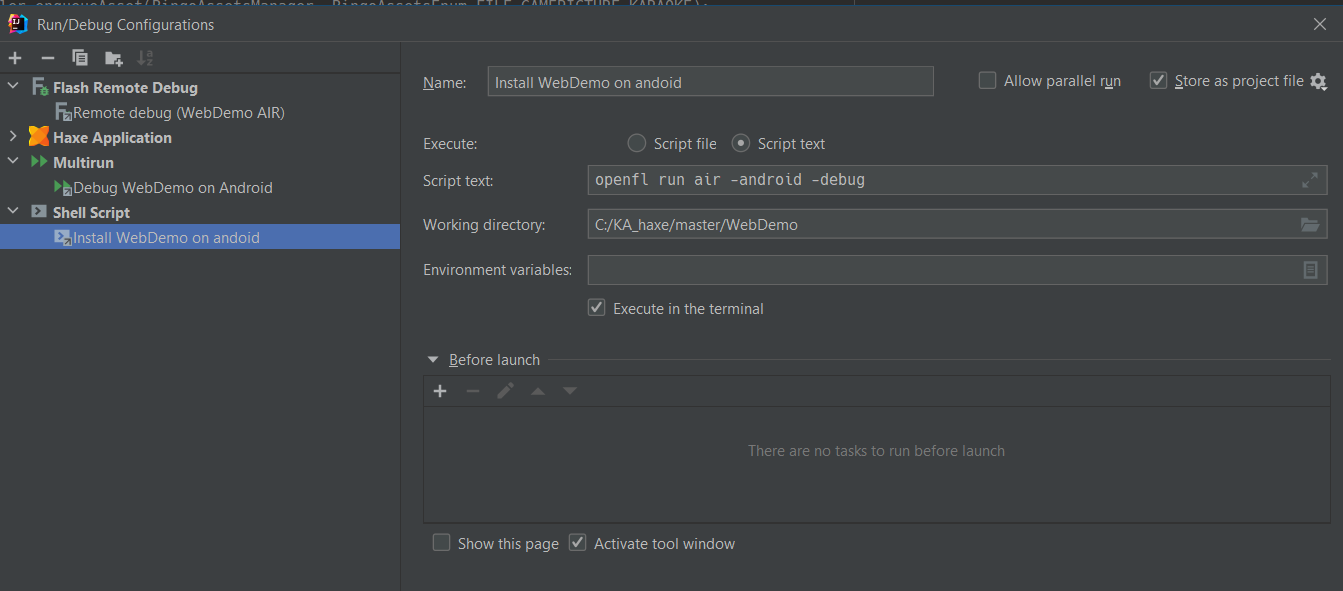
- Create run configuration with Shell Script plugin.
- Create Debug-in-one-key ddebug configuration with Multirun plugin.
Why I use plugins instead of standart tools? Because some commands doesn’t return 0 result as required by standart tools, another tools can’t run in debug mode.
3 Likes