I’d want to propose to discuss this bug report I’ve created today. I believe that problem is wider that just about Tilemap. Tilemap is just a simplest way to describe it.
I noticed that playing very simple MovieClip exported from swf asset loads CPU&GPU to much. I thought the key could be in some swf export procedures or something like that and I started to find a different approach to play the animation.
I rasterized MovieClip frame by frame and tried copyPixels approach on each ENTER_FRAME. Nothing has been changed. I tried to use Tileset with Tilemap and again nothing has been changed. CPU& GPU load were so high for such simple operations with bitmap of 200x50 with 1:1 scale.
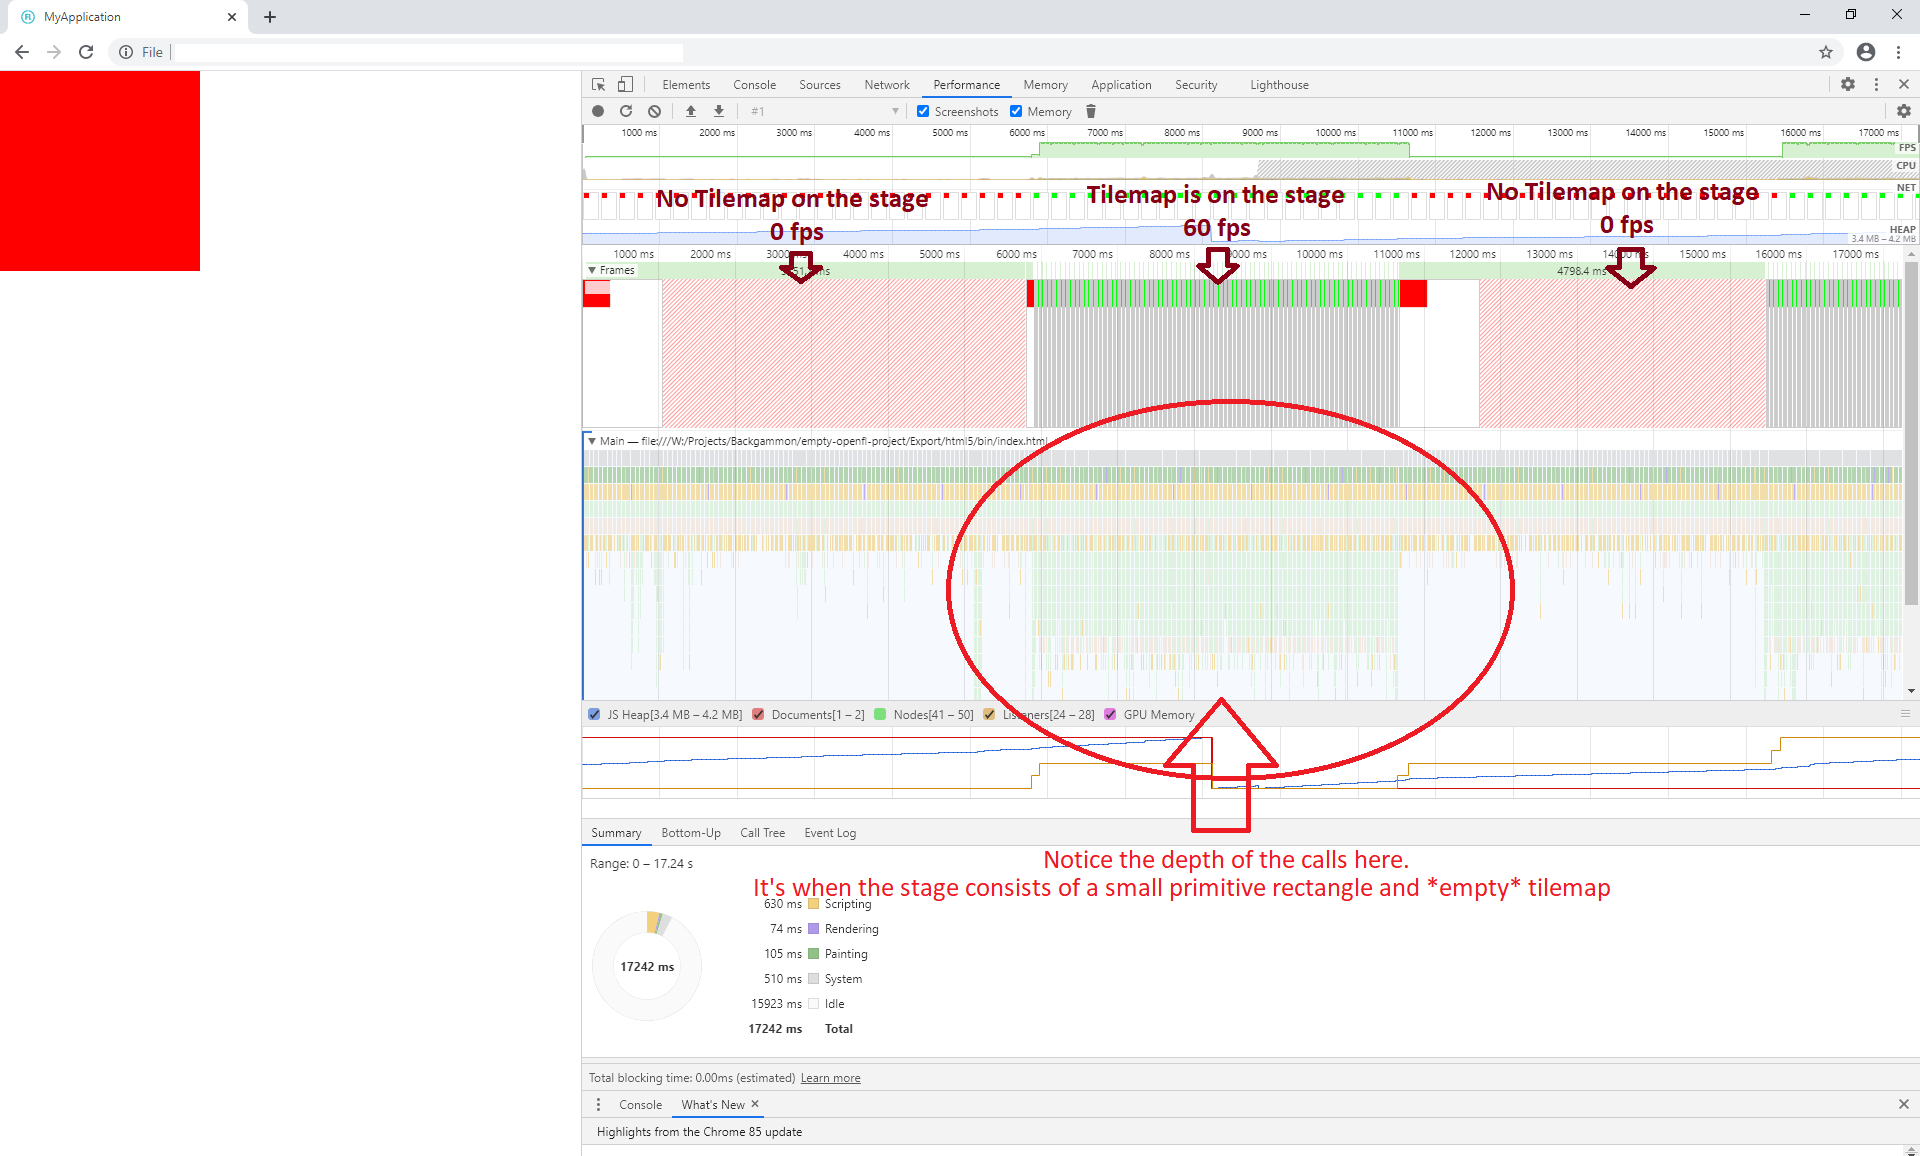
So I’ve created the empty project. And tried to put an empty 1x1 Tilemap on the stage. The result was the same: CPU&GPU load was inadequately high.
What is that and is the any approach or workaround to solve it? Thank you for your cooperation.
How does the performance compare if you remove the Tilemap, or you just add a single Bitmap? Does the performance still seem too high for you or is it more specific to Tilemap?
After removing Tilemap, CPU&GPU load drops to zero. After adding, rise again. To demonstrate this behavior I’ve created a sample project in the github bug report.
If I add/remove Bitmap nothing happens. CPU&GPU load stays still.
Thanks you. But I think this patch is such an ad-hoc thing. Moreover, using empty tilemaps is pointless.
Tilemap is not the only thing. I mentioned it here only for demonstration purpose. Please, see initial post. What I want to tell is pure window.requestAnimationFrame loads cpu&gpu relatively at least twice less. It points me to conclusion that a lot of work is done in openfl/lime routines on each frame. And some of that work seems unnecessary. What do you think about it?
empty tilemap may be not that “descridable” for this kind of problems. It surely has structured cost just to prepare anything to render - even 1 pixel should be packed, sent on GPU, etc.
what happen with CPU load if you use your original tilemap instead of empty? will it stay at 4% or it will scale significantly according to tilemap “heaviness”?
If you read the initial post, you see that it’s not about tilemaps only. I thought that empty tilemap is an ideal way to show that enter_frame cycle takes to much even for nothing. In comparison, take a look at this javascript code and cpu&gpu load. It’s spends ~35% less of cpu time and ~55% less of gpu. BTW, it updates every pixel of all the scene on every frame: ctx.fillRect(0, 0, canvas.width, canvas.height);
I don’t have heavy animations to compare. I noticed that heavy load behavior on my simple looped not scaled animation of 176 frames of 63x27px on 60fps. Answering your question, the load is rising a bit with my animation, no matter packed as movieclip or rasterized and tiled.
Although Joshua says that he has 1.3ms per frame I still believe that cpu load of 6.5% and gpu of 21% for that kind of operations is inadequate. BTW, if we count straightforward, 1.3ms is around 7.8% of cpu time with 60fps.