Can't fit the stage to the shown area for HTML5 target

Hello,

This has been driving me really crazy and I would be really happy if you guys have a solution for this. And I’m pretty sure there are many people out there trying to deal with the same problem, wishing there is a simple way. So here it goes:

I can’t fit the stage to the white area which is shown when you open the non-scrollable page for testing.

My browser zoom is 125% by default - which is very common - and I use Google Chrome. I tried adding:

<window width="0" height="0" />

to my project.xml. And I also added:

stage.align = StageAlign.TOP_LEFT;
stage.scaleMode = StageScaleMode.NO_SCALE;

Still doesn’t work. What I do when I initialize my project is to put a button to the bottom left corner with this:

stageWidth = stage.stageWidth;
stageHeight = stage.stageHeight;

buttonWidth = stageWidth/8;
buttonHeight = stageHeight/10;
buttonX = 0;
buttonY = stageHeight - buttonHeight;

Then of course I create my button instance with few more parameters for colour etc. and “addChild” to stage.

What happens is:

  • Stage dimensions are shown “1920x969” with 100% browser zoom.
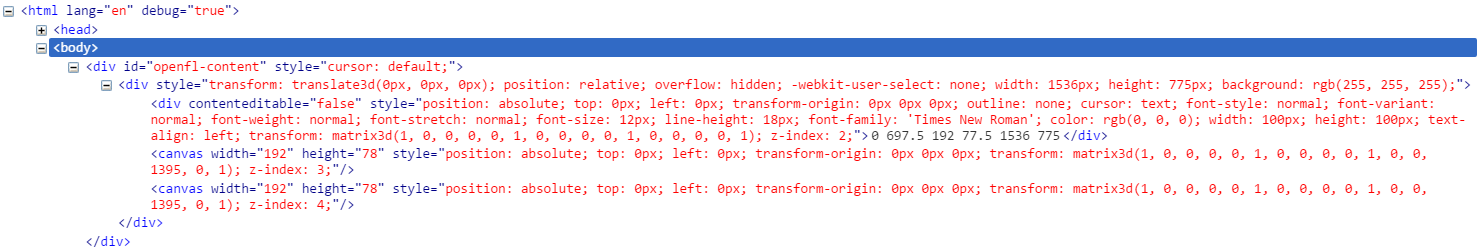
  • Stage dimensions are shown “1536x775” with 125% browser zoom.
  • My button is out of bounds using both options as default browser zoom.

How do you guys get through this problem?

Do those sizes appear correct? Or does it appear to be sized larger than the viewable area?

Thank you for a quick response!

Yes, sizes appear to be correct since it gives 1920 pixels for 100% zoom. And even in 100% zoom, my button is out of bounds still where calculations seem to be correct.

For example, with 125% zoom, stage width is 1536 pixels and height is 775 pixels. When I manually set buttonX = 0 and buttonY = 350, it looks like it snaps to the bottom left corner. Weird isn’t it? It should have been somewhere in the middle on Y-axis.

Edit: Misspelling.

Can you run an HTTP debugger and check what size the canvas is? Does it report the same 1920 size, or something smaller?

Excuse me, but what is an HTTP debugger? Google gives me no results for it.

Do you mean the “div” tag under index.html?

Edit: Misspelling. Oh god. ^^

He probably misspelled too :wink:
Think he was speaking of an HTML debbuger like firebug :wink:

So here I go full n00b: How am I supposed to used that? :grin:

I am used to use firebug but there are many other. And even the debugger console embedded in chrome or the firefox “inspect element” function would be enough for your case I guess (so you probably don’t need to install an addon).

Anyway, I you want to use firebug, install the extension for firefox or chrome: https://addons.mozilla.org/en-US/firefox/addon/firebug/ or https://getfirebug.com/releases/lite/chrome/
Activate it by clicking on the little bug icon (should open a frame with the debuger) and then relooad your HTML5 application. Then you can inspect your html5 page code source (and modify it on the fly if you want to) on the debuger console and you will have all the informations concerning your html5 objects in it.

Thank you very much!

Is this what I should be looking for?

<div style="transform: translate3d(0px, 0px, 0px); position: relative; overflow: hidden; -webkit-user-select: none;     width: 1536px; height: 775px; background: rgb(255, 255, 255);">
<div contenteditable="false" style="position: absolute; top: 0px; left: 0px; transform-origin: 0px 0px 0px; outline: none;    cursor: text; font-style: normal; font-variant: normal; font-weight: normal; font-stretch: normal; font-size: 12px; line-height: 18px; font-family: 'Times New Roman'; color: rgb(0, 0, 0); width: 100px; height: 100px; text-align: left; transform: matrix3d(1, 0, 0, 0, 0, 1, 0, 0, 0, 0, 1, 0, 0, 0, 0, 1); z-index: 2;">0 697.5 192 77.5 1536 775</div>
<canvas width="192" height="78" style="position: absolute; top: 0px; left: 0px; transform-origin: 0px 0px 0px; transform: matrix3d(1, 0, 0, 0, 0, 1, 0, 0, 0, 0, 1, 0, 0, 1395, 0, 1); z-index: 3;"/>
<canvas width="192" height="78" style="position: absolute; top: 0px; left: 0px; transform-origin: 0px 0px 0px; transform: matrix3d(1, 0, 0, 0, 0, 1, 0, 0, 0, 0, 1, 0, 0, 1395, 0, 1); z-index: 4;"/>

Well yes. You should be looking at the source code but also the computed rendering. With firefox or chrome “inspect element” function, you can see a “computed” or “box model” tab (that is the “layout” tab on firebug) where you have a visual scheme of your element box size and borders. Here you can check that the dimensions are the one you are expecting and that there is no other thing in your code that is messing with the dimensions your div have in their tag… If this is the case, you have to trace back using the “computed” debuger tab to understand what is changing their properties

When I try to “inspect element”, nothing seems to be wrong about “padding, border, margin, position”.

When I look into div under “Properties” tab, the only number that seems weird to me is “scrollHeight: 1473”. Could this be causing the problem? Because I didn’t set anything about it.

On Windows, Ctrl + Shift + i is the shortcut to “inspect” the page (I think “Web Inspector” is a common term for this), on Mac it’s a bit different (Cmd + Alt + i or something funny)

You can click the magnifying glass to click an element, then you can see it’s size, CSS properties, etc. You can see the console tab as well to get your traces from OpenFL projects. You should also be able to see a view of the page’s DOM so you can see what elements are on the page (such as the canvas element)

I never use Firebug myself, just whatever is built into the current browser :slight_smile:

“Computed” debugger tab reports:

width	1536px
height	775.2px

for “Box Model”.

Under div tag, what I have is this and it doesn’t mention anything about “canvas” except for giving the button dimensions and position:

However, I see a “1395” number there which I don’t wish to be my button’s vertical position. Or is it?

Edit: And this is what it says when I inspect the button:

Could you share your Haxe source?

Just a quick add, F12 in Chrome, IE, or Firefox will bring up dev tools, such as console output and memory profiling. They are all very useful tools for debugging!

Sorry for a late response, I was away from any internet connections for a week.
Thank you jonnym!

Here is the main class:

package;


import openfl.display.Sprite;
import openfl.display.StageAlign;
import openfl.display.StageScaleMode;

import openfl.text.TextField;
import openfl.text.TextFieldAutoSize;

import Rekt;

class Main extends Sprite 
{
    private var stageWidth:Float;
    private var stageHeight:Float;

    private var buttonX:Float;
    private var buttonY:Float;
    private var buttonWidth:Float;
    private var buttonHeight:Float;
    private var buttonBGColour:Int;
    private var buttonText:String;
    private var buttonTextCenter:Bool;

    private var rekt:Rekt;
    private var tf:TextField;

    public function new() 
    {
        super();

	stage.align = StageAlign.TOP_LEFT;
	stage.scaleMode = StageScaleMode.NO_SCALE;

	stageWidth = stage.stageWidth;
	stageHeight = stage.stageHeight;

	buttonWidth = stageWidth/8;
	buttonHeight = stageHeight/10;
	buttonX = 0;
	buttonY = stageHeight - buttonHeight;

	buttonBGColour = 0x1F2E3B;
	buttonText = "BUTTON";
	buttonTextCenter = true;

	rekt = new Rekt(buttonX, buttonY, buttonWidth, buttonHeight, 
		buttonBGColour);

	addChild(rekt);

	tf = new TextField();
	tf.appendText(buttonX + " " + buttonY + " " + 
		buttonWidth + " " + buttonHeight + "\n" + stageWidth + "\n" +
		stageHeight);

	addChild(tf);

    }
}

And this is the class “Rekt” I use for making a button, which inherits from SimpleButton:

package;


import openfl.display.Sprite;
import openfl.display.Shape;
import openfl.display.SimpleButton;

import openfl.text.TextField;
import openfl.text.TextFormat;

import openfl.events.Event;

class Rekt extends SimpleButton
{

    private var colour:Int;
    private var _X:Float;
    private var _Y:Float;
    private var _Width:Float;
    private var _Height:Float;

    private var textFormat:TextFormat;
    private var textField:TextField;

    private var _upState:Shape;
    private var _downState:Shape;
    private var _overState:Shape;
    private var _hitTestState:Shape;

    private var stripHeight:Float;
    private var stripWidth:Float;

    public function new(_x:Float, _y:Float, _width:Float, _height:Float,
	    colour:Int):Void
    {
	super();

	_X = _x;
	_Y = _y;
	_Width = _width;
	_Height = _height;
	this.colour = colour;

	_upState = new Shape();
	_upState.graphics.beginFill(colour);
	_upState.graphics.drawRect(_X, _Y, _Width, _Height);
	_upState.graphics.endFill();

	_downState = new Shape();
	_downState.graphics.beginFill(colour, 0.7);
	_downState.graphics.drawRect(_X, _Y, _Width, _Height);
	_downState.graphics.endFill();

	_overState = new Shape();
	_overState.graphics.beginFill(colour, 0.8);
	_overState.graphics.drawRect(_X, _Y, _Width, _Height);
	_overState.graphics.endFill();

	_hitTestState = new Shape();
	_hitTestState.graphics.beginFill(colour);
	_hitTestState.graphics.drawRect(_X, _Y, _Width, _Height);
	_hitTestState.graphics.endFill();

	stripWidth = _Width;
	stripHeight = _Height/8;

	addStrip(_upState);
	addStrip(_downState);
	addStrip(_overState);
	addStrip(_hitTestState);

	upState = _upState;
	downState = _downState;
	overState = _overState;
	hitTestState = _hitTestState;

	addEventListener(Event.ADDED_TO_STAGE, called);
    }

    private function called(e:Event):Void
    {
	this.x = _X;
	this.y = _Y;
	this.width = _Width;
	this.height = _Height;
    }

    private function addStrip(object:Shape)
    {
	object.graphics.beginFill(0xFFFFFF, 0.5);
	object.graphics.drawRect(_X, _Y, stripWidth, stripHeight);
	object.graphics.endFill();
    }
}

I use openfl test html5 -Ddom to test my project. My project.xml file is the one lime creates by default.

Does anybody come across such a problem? What do you get when you build with this code?

It would be really helpful if somebody could try once for me, I still can’t get through this. :pensive: