What is your FPS? Could you target a lower FPS on Mac?
My first guess is GPU performance (and something strange on that note), but I’ll keep thinking.

What is your FPS? Could you target a lower FPS on Mac?
My first guess is GPU performance (and something strange on that note), but I’ll keep thinking.
This looks like it will be very difficult to track down. For now I managed to keep CPU usage down by modifying stage.frameRate on runtime – application is listening to events and if nothing changes, frame rate is kept at 5 FPS, otherwise it raises to 30 FPS, before it was always 60 FPS. Thanks for a hint.
Not sure about Windows / macOS difference. At first I also thought it’s something wrong with Intel HD 3000, but on Windows in VirtualBox it runs fine and afaik it also uses macOS drivers under it. Or could Windows have some mechanism to not render window anew if it didn’t change?
Question: Would it be possible to implement some low impact mechanism to not process / render DisplayObject or Graphics all over again, if it didn’t change from previous frame? I could try to hack something myself, but you certainly know better where would be the right spot to do this in the rendering chain. I believe it could save a lot of resources on some targets.
Just to support these findings: I have a much faster Mac (latest Macbook Pro with ATI 460) but still see around 67% CPU usage
We’re working to that end, we need additional fixes on flagging renderDirty internally so that we catch render changes, but we’ve been making good progress
BTW, this looks interesting:
Not on a Mac right now, so I can’t test changes, but the amount of sleep allowed in the main loop can have a big difference on CPU performance
Great news!
I just tested both cases of this on current git Lime and I’m getting roughly same performance.
Hello @wildfireheart,
Try solution if performance runs faster if you will know.
class Main extends Sprite {
private var tf:TextField;
public function new () {
super ();
for (i in 0...1000){
  	var sprite = new Sprite();
		sprite.addEventListener(MouseEvent.CLICK, callback);

		sprite.graphics.beginFill(0xFF00FF00);
		sprite.graphics.drawRect(0, 0, 50, 50);
		sprite.graphics.endFill();
		Lib.current.addChild(sprite);
  }

  tf = new TextField();
  tf.background = true;
  tf.backgroundColor = 0xffffffff;
  tf.text = "For: " + (Lib.getTimer()+"ms");
  tf.x = tf.y = 100;
  Lib.current.addChild(tf);
}
private function callback(evt:Event):Void
{
tf.text += “\nClicked me!”;
tf.text += "\nFor: " + (Lib.getTimer()) + “ms”;
}
}
Result: 245ms from drawing sprite
1935ms is clicked event
If you use var callback = function(evt:Event):Void { … }
Result 266 to 270ms It is slower than private function callback(evt:Event):Void { … }
and Clicked event from variable callback is 4225ms. You forget to write “Void” after var callback = function(evt:Event):Void { … }
Result: from Sprite is 268ms, clicked event in variable is 2952ms.
Don’t forget optimization of fast performances: HAXE and AS3 are very same.
private function handle(e:Event, MouseEvent etc...):Void { .. }
faster than:
in current function or variable gives function
Please show me with ms or s how is performance?
If you can’t resolve it. Than @singmajesty will fix Lime / OpenFl.
As far as I know, it is not necessary to write types explicitly, Haxe compiler will resolve it for you anyway.
EDIT: In this case it seems to compile to Dynamic, so it can be actually a bit slower, but I didn’t test it.
But it doesn’t matter, the problem we are solving here is that same code does a lot less CPU activity (roughly 10x less) on Windows (even in VM) than on macOS on the same computer. The code I posted is just an example to show the problem, I’m not using it.
How does PiratePig perform? I ran some tests on my 13" MacBook, I get 95% CPU use from openfl test neko, but approximately only 4.5% CPU use from openfl test mac. Changing the demo to use 60 FPS increased the CPU to about 9.5% CPU, and then enabling vsync brought it lower to about 8.2% CPU.
This seems reasonable, but perhaps there is something triggering different performance on your machine?
Well I’m also getting around 9% CPU on PiratePig with openfl test mac but honestly, it doesn’t use that many Sprites. You need much higher number of sprites to see the difference between Windows and macOS. Just use the example I posted on the beginning of this thread, it illustrates how for example HaxeUI OpenFL backend works – it redraws component graphics (each component consists of one or more Sprite instances) only when something changes and then does nothing.
Speaking about that example, you need to draw something on sprite.graphics to see the problem, when I just add 1000 empty Sprite instances with event listeners, CPU usage is around 4%, as soon as I draw one single colour rectangle on every Sprite, CPU usage raises to 75% CPU on macOS, while it stays around 5% on Windows.
PS: 1000 sprites aren’t that many, when you have even slightly complex UI (with tables of components for example), as I’m doing right now. It could probably be done more efficiently with Tiles or whatever, but it still doesn’t explain the macOS/Windows difference.
It’s definitely not the problem of my machine, I was thinking about it before, but I tried the example code on two different MPB (with Intel HD 3000 and Intel HD 4000) and it behaves the same, also @hak88 confirmed the issue on Mac with ATI card, so it’s not Intel graphics problem either. I’m guessing it will be either something in SDL, SDL/Lime interfacing layer or maybe even some quirk in OpenGL implementation on macOS (which is traditionally not great) which Lime by chance uses. But I did quick search and didn’t find any complaints about major SDL performance difference on macOS/Windows so I don’t know.
We will hit Cairo performance when the vector graphics are redrawn, but then it’s up to OpenGL for each frame afterward. Perhaps the drivers are better on Windows or we are hitting a slow path on macOS for some reason
Probably. Btw, I also checked with current NME and it behaves similar, if that information helps.
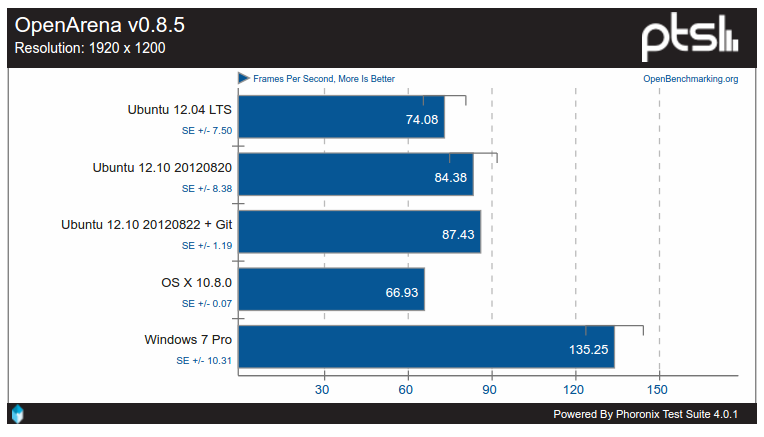
This is an older version of macOS and Windows, but these numbers seem relevant
Does anyone know debuggers/profilers for OpenGL on macOS?
I’ve seen this article, but I would not expect 7x-10x worse CPU time than on Windows, normal and in VM.
As to profiling, Xcode has one, but I never used it before. Btw, it’s somewhat broken in Xcode8:
https://forums.developer.apple.com/message/204679. You should be able to run it by enabling remote profiling from the preferences (checkbox is disabled while you don’t set a password). Once enabled, you should be able to connect to it (even from same machine) and attach profiler to the running application you want to debug. I’ll probably try it myself.
I was about to ask about Lime and Metal support on macOS, but I doubt @singmajesty has time to work on it and I don’t know, whether there are enough Lime users targeting macOS to make it worth it. So I guess until someone doesn’t do it, it won’t be done. But that would be another topic.
Given Apple’s announcement of deprecating OpenGL, does that increase the priority of having Metal support (or is that in there already?)
It does offer the option of using ANGLE -> MoltenVK -> Metal, but I’m not sure. We might up the importance of writing a Vulkan renderer, and then using MoltenVK on macOS
Is there any new progress in this? My performance on the Mac, the FPS display is stable, but the picture looks very stuck.